DROPWEBS
Response Analytics

Response rate is a number you can actually move.

Response Analytics computes how many reviews you answered, broken down by rating, by location and over time, entirely from your stored review data. Where Google omits a timestamp, the metric is marked unavailable rather than estimated.

The problem

You cannot manage a number nobody is measuring.

Everyone agrees you should reply to reviews. Almost nobody can say what percentage they replied to last month, whether the one-stars were answered faster than the five-stars, or which of their five locations is quietly ignoring customers. The number is knowable. It is just not being counted.

Google shows you reviews, not your coverage of them.

Averaging percentages across locations produces a figure that is simply wrong.

One-star reviews are the ones that matter most and the ones most often skipped.

Tools that estimate response time from missing data are making it up.

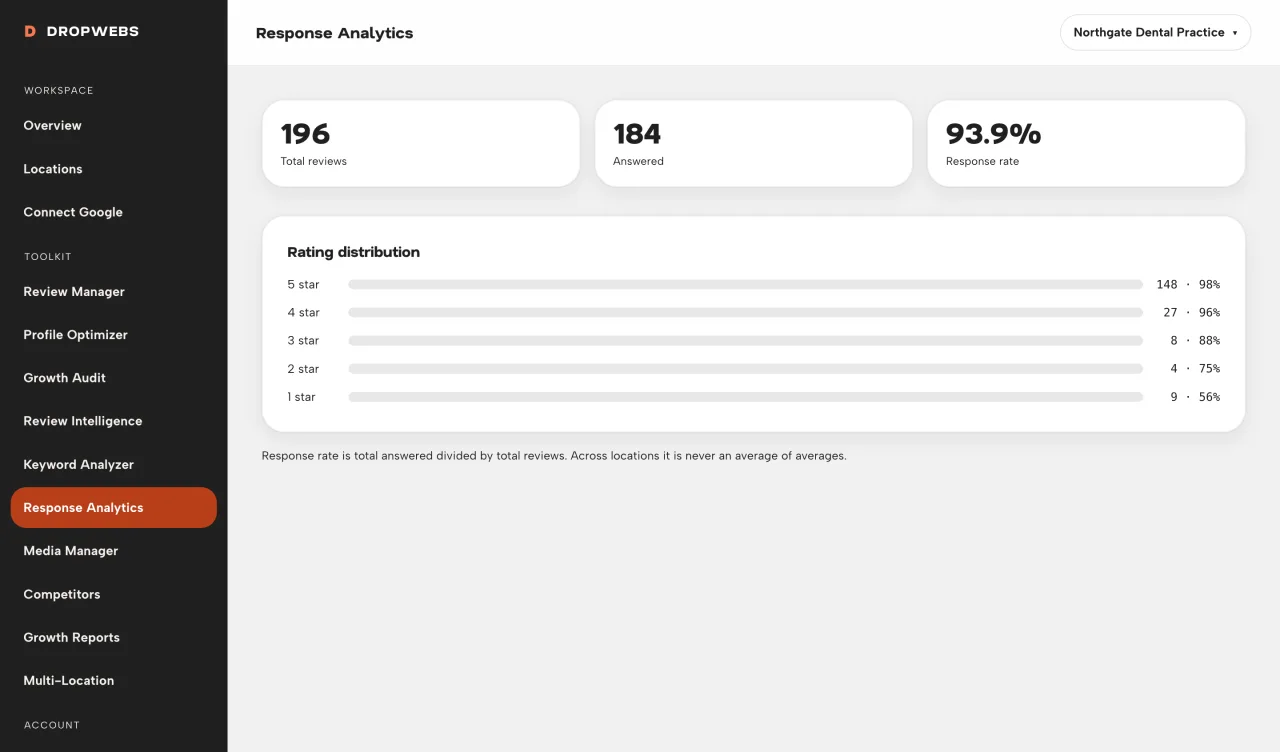
What Dropwebs does: Response Analytics measures answered vs unanswered reviews, response rate by rating, monthly activity, and response time when both timestamps exist.

Response Analytics in Dropwebs showing total, answered and unanswered review counts with response rate

Coverage

Answered, unanswered, and the real percentage.

Total reviews, how many carry a reply, and the resulting rate. Across multiple locations the figure is computed as total answered over total reviews, not as an average of each location's percentage, because averaging percentages of different-sized sets gives you the wrong answer.
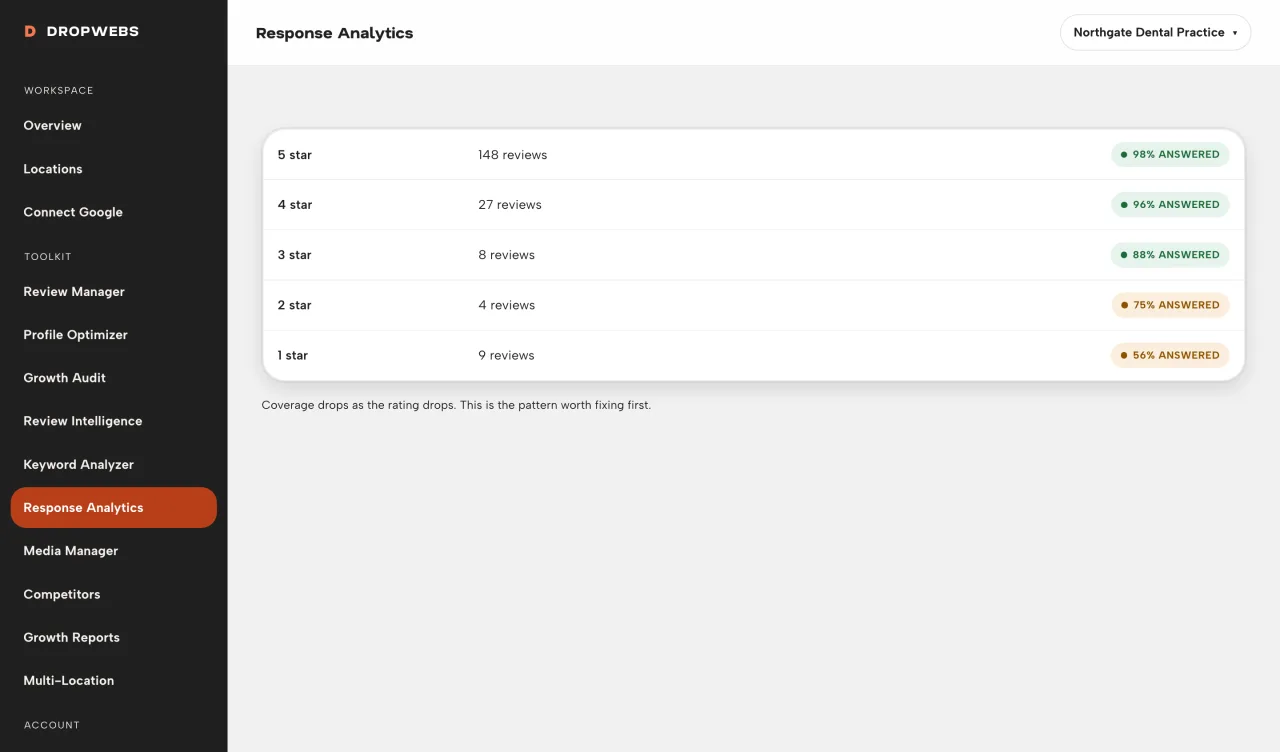
Response rate broken down by star rating in Dropwebs

By rating

Find out if you are avoiding the one-stars.

Response rate is broken out per star rating. It is a common and uncomfortable pattern: five-star reviews get a cheerful reply within a day, one-star reviews sit unanswered for a month. This is the view that surfaces it.

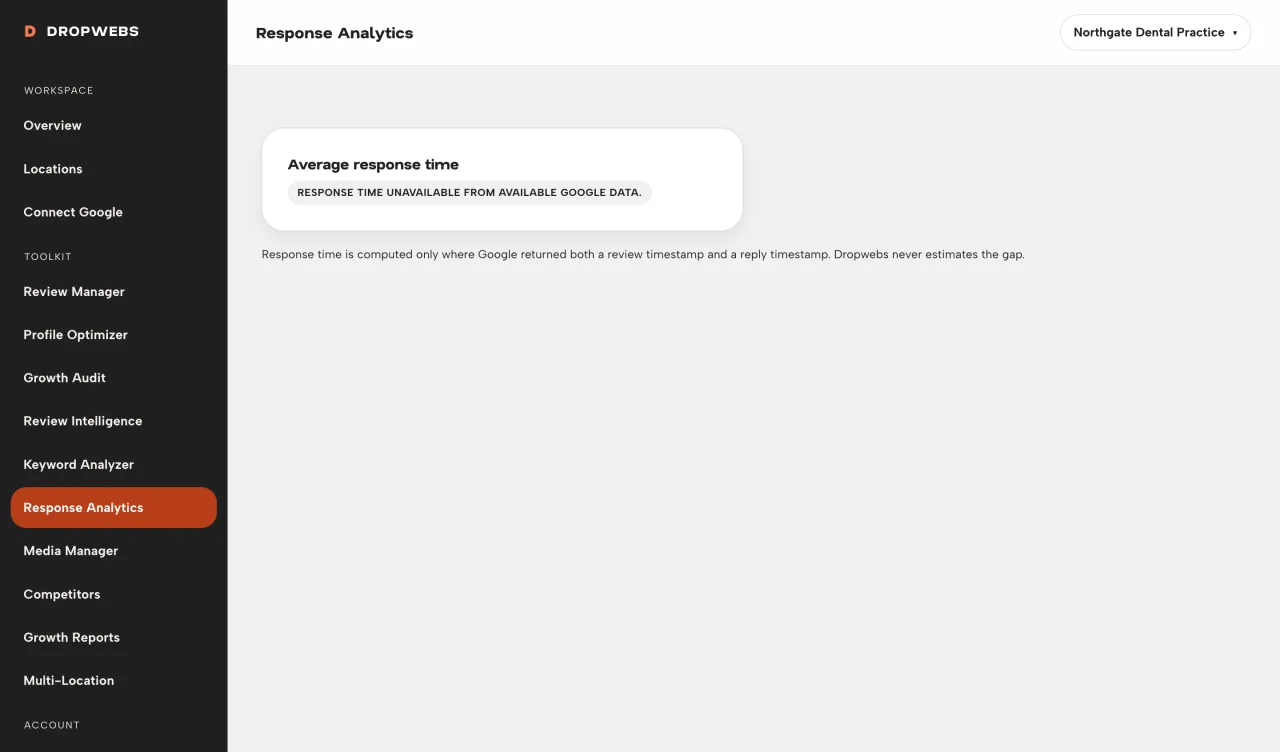
Dropwebs marking response time as unavailable where Google timestamps are missing

Honesty

Response time only when the timestamps exist.

Average response time is computed only from reviews where Google supplied both the review time and the reply time. If those are missing, Dropwebs shows the metric as unavailable and explains why. It never fills the gap with an estimate that would look like a fact.

How it works

From connection to result.

01

Step 1

Select a location with synced reviews.

02

Step 2

Review response rate and unanswered counts.

03

Step 3

Check response time only if timestamps are available.

04

Step 4

Open Review Manager for weak spots.

What it gives back

A metric you can put in front of anyone.

Correct aggregation

Total over total, so multi-location figures hold up.

Blind-spot detection

Per-rating coverage exposes the reviews you avoid.

Trend, not snapshot

Monthly series shows whether you are improving.

No invented numbers

Unavailable is stated, not estimated.

How to use it

Your first run, step by step.

01

Step 1

Sync reviews before reading charts.

02

Step 2

Focus on unanswered count first - that is actionable today.

03

Step 3

Use Multi-Location Manager to compare branches.

04

Step 4

After publishing replies, sync again to refresh rates.

Limitations

What this tool cannot do.

Response time requires both a review timestamp and a reply timestamp from Google. Missing either, the metric is unavailable.

Figures cover reviews Dropwebs has synced. Sync a location before reading its analytics.

These are your own coverage metrics. They are not Google performance or impression data.

Questions

Straight answers about response analytics.

What it does, what it will not do, and where the data comes from.

Why is response time unavailable?

Google must provide both review and reply timestamps. If either is missing, we show UNAVAILABLE.

Zeros with no reviews?

Zero means no synced reviews yet - not fake activity.

Why is my response time blank?

Because Google did not return a reply timestamp for those reviews. Dropwebs will not estimate a duration it cannot measure, so the metric stays unavailable with an explanation rather than showing a number you might repeat to a client.

Why does my multi-location rate differ from averaging each location?

Because averaging percentages ignores size. A location with 400 reviews and one with 8 do not carry equal weight. Dropwebs divides total answered by total reviews, which is the correct calculation.

Get started

Try Response Analytics on your own profile.

Free plan, no card. Connect Google and this tool has real data to work with in about a minute.

How to use it

Operator guide for Response Analytics.

Workspace steps and real screens. This is a how-to, not a second overview of the tool.

Open the guide