DROPWEBS
Growth Reports

A report you can send without checking it first.

Growth Reports assembles your real profile and review data into an owner-ready summary, with Google-sourced figures, calculated metrics, AI-written insight and user-supplied information each clearly distinguished.

The problem

Client reporting eats the day it was meant to justify.

The monthly report is the part of the job that pays for the rest, and it is the part that gets rebuilt by hand every time. Numbers are copied between tabs, a summary is written from scratch, and somewhere in the assembly a figure loses track of where it came from.

Manual assembly means transcription errors nobody catches.

Mixed-source reports make it impossible to say which figure came from Google.

Writing the executive summary is the slowest part of an otherwise mechanical job.

Last month's report is not comparable to this month's if the method changed.

What Dropwebs does: Growth Reports combine current performance, review trends, response rate, sentiment themes, audit findings, keyword opportunities, and recommended actions.

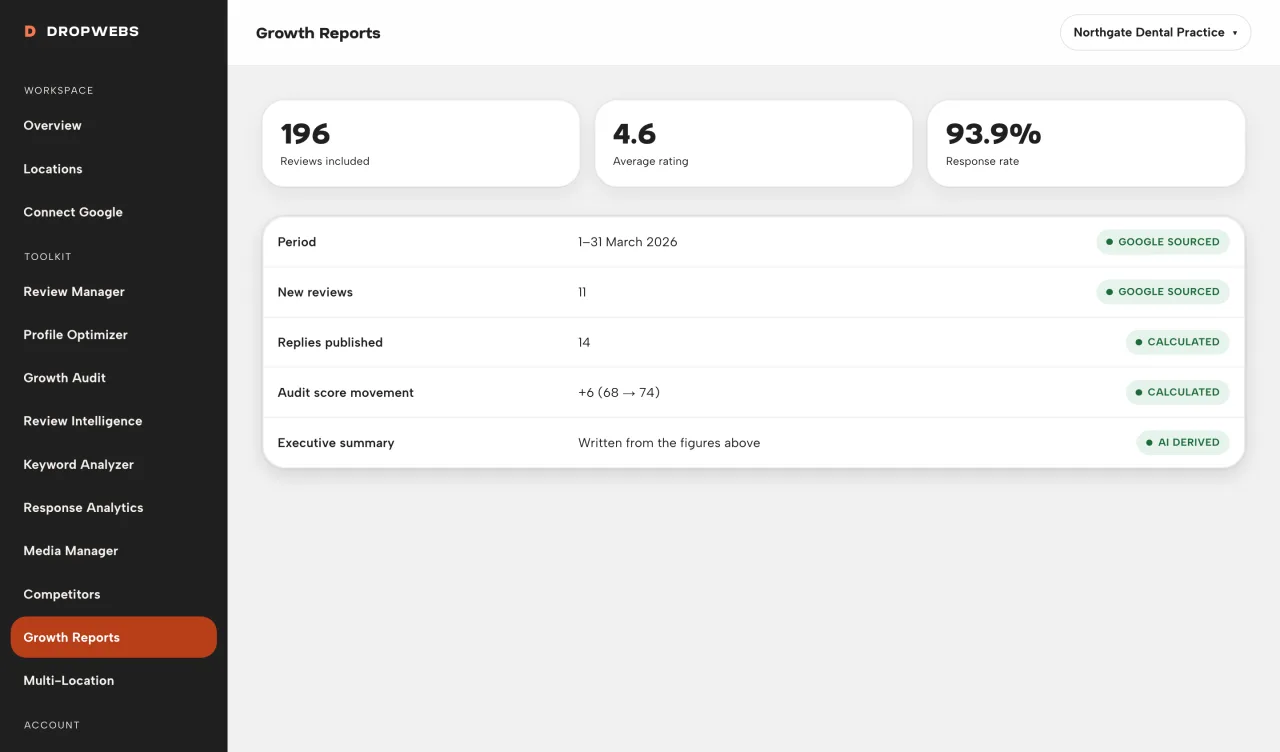
Generating a growth report in Dropwebs from synced Google Business Profile data

Assembly

Built from your data, not retyped.

The report is generated from the profile and review data already synced to your account: ratings, volume, response coverage, audit findings and movement since the last snapshot. Nothing is copied by hand, so nothing is mistyped.
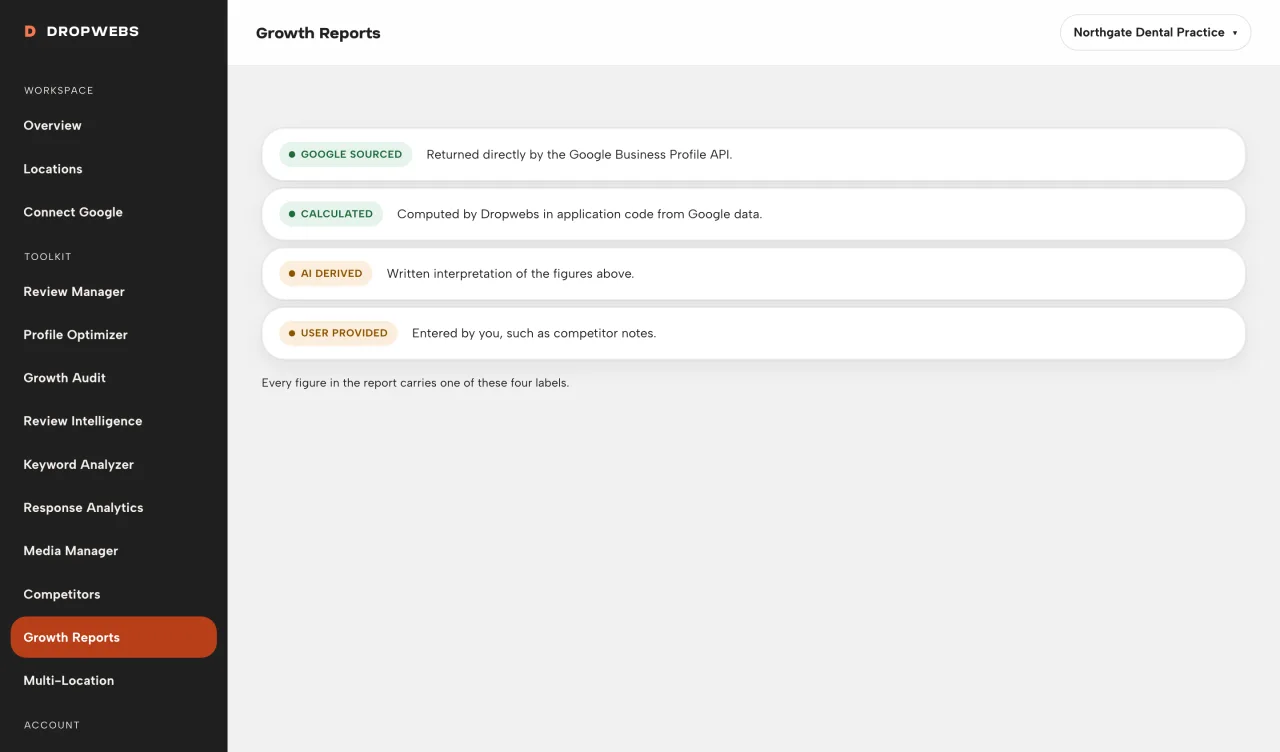
A Dropwebs growth report labelling each metric as Google sourced, calculated, AI derived or user provided

Provenance

Four labels, applied to every figure.

Google-sourced, calculated, AI-derived and user-provided. A reader can tell at a glance which numbers came from Google, which Dropwebs computed, which are written interpretation, and which you supplied. That is the difference between a report and a pitch deck.

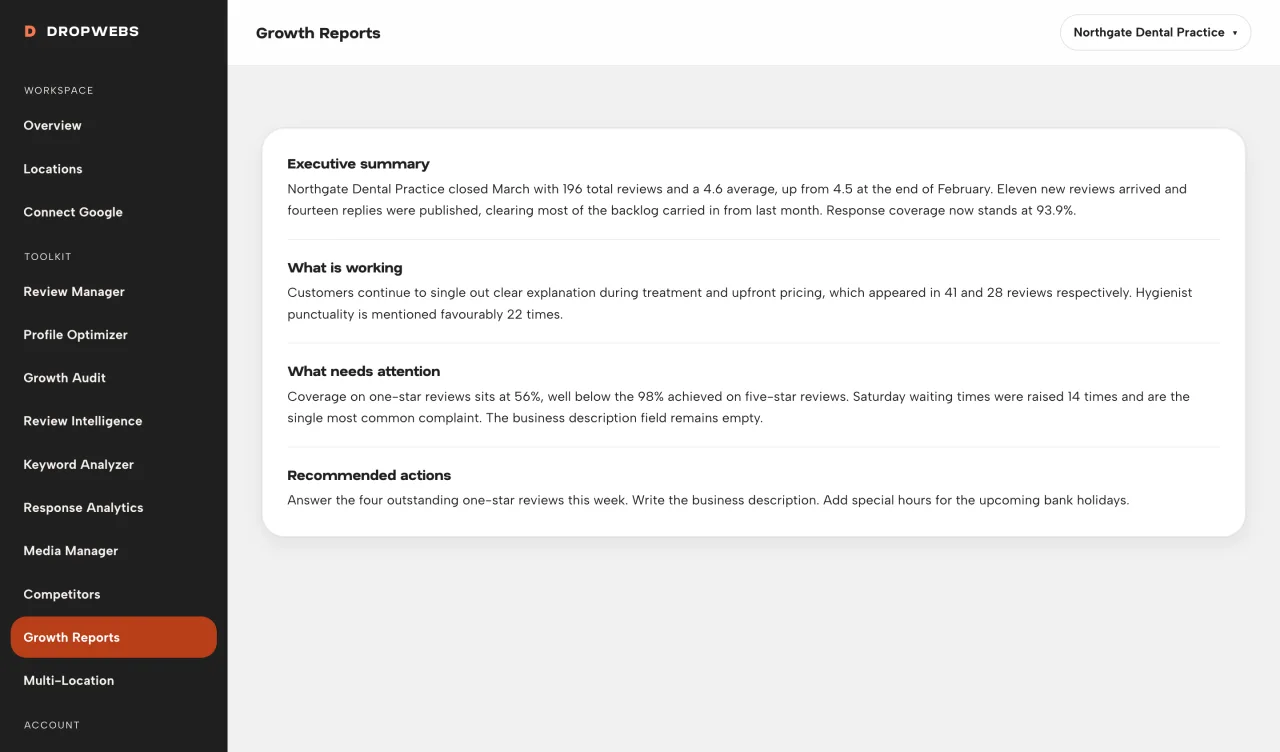
Executive summary and recommended actions section of a Dropwebs growth report

Summary

The executive summary, already written.

An opening summary in plain English covering what moved, what is working and what needs attention, followed by recommended actions. It reads as interpretation of your data, and it never claims history that Dropwebs has not actually recorded.

How it works

From connection to result.

01

Step 1

Select a location with synced data.

02

Step 2

Generate a report from real snapshots.

03

Step 3

Review sections and recommended actions.

04

Step 4

Print or revisit the saved report.

What it gives back

The monthly report, minus the monthly.

Generated, not assembled

Data flows straight from your synced account.

Consistent method

This month is genuinely comparable to last month.

Summary included

The slow, written part arrives already drafted.

Traceable

Every figure declares its source in the document.

How to use it

Your first run, step by step.

01

Step 1

Sync reviews and run an audit before your first report when possible.

02

Step 2

Generate the report and open it from the list.

03

Step 3

Share recommended actions with your team.

04

Step 4

If history is thin, expect an honest “unavailable before connection” note.

Limitations

What this tool cannot do.

Reports cover data Dropwebs has synced. A location must be connected and synced before it can appear.

Trend sections require more than one snapshot. Dropwebs will not fabricate a history it has not recorded.

AI-written sections are interpretation of your data and are labelled AI-derived throughout.

Questions

Straight answers about growth reports.

What it does, what it will not do, and where the data comes from.

Can I invent last year’s numbers?

No. Reports only use stored snapshots and current data.

Is export available?

You can view and print reports. Follow on-screen export options when enabled.

Can I send this to a client as-is?

That is the intent. Figures carry their source labels, the summary is written in plain English, and there are no invented benchmarks. Read it before you send it, as you would any document going out under your name.

Why is there no trend on my first report?

Because a trend needs at least two snapshots and the first report only has one. Rather than draw a line through a single point, Dropwebs omits the trend until it has real history to show.

Get started

Try Growth Reports on your own profile.

Free plan, no card. Connect Google and this tool has real data to work with in about a minute.

How to use it

Operator guide for Growth Reports.

Workspace steps and real screens. This is a how-to, not a second overview of the tool.

Open the guide